
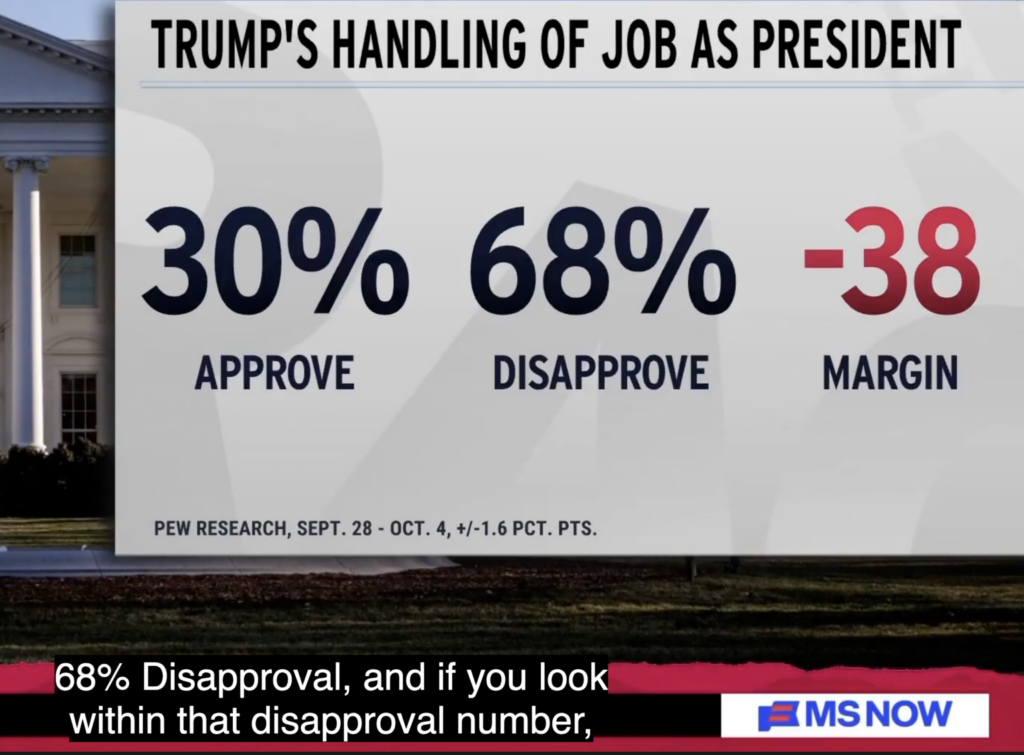
On October 8, 2026, Pew Research Center released a report headlined “With Americans in a Sour Mood, Democratic Voters Are More Engaged in Midterms,” accompanied by a subheadline: “Trump approval drops to 30%, as 44% of voters see their vote as ‘against’ him.”
To the casual observer scrolling through political headlines or watching corporate cable news broadcasts, this figure appears to be a precise, scientific gauge of the active American electorate. Pew officially described its survey methodology with supreme institutional confidence:
“We surveyed 5,062 U.S. adults, including 3,917 registered voters, from Sept. 28 to Oct. 4, 2026. Everyone who took part in this survey is a member of the Center’s American Trends Panel. The survey represents the views of the full U.S. adult population.”
But stating that a survey represents the entire population does not make it true, and Pew’s own data disproves it. The American Trends Panel is a sample of adults ages 18 and older living in the United States. It is not limited to citizens, it is not limited to registered voters, and it is not even limited to legal residents. They are also members aka professional poll takers.
While the questionnaire supposedly restricts specific, secondary voting questions exclusively to citizens, the primary headline question tracking Trump’s presidential job approval is explicitly marked “ASK ALL.” The widely cited 30% figure therefore incorporates responses from people who are not registered to vote, from noncitizens, and from people in the United States illegally.
Ask yourself: Do you really care if non-citizens, including illegal ones, approve of President Trump?
Pew’s “ASK ALL” means exactly what it says. No voter registration, citizenship, or legal residency is required—just an opinion, time to spare, being a member, and a desire for a check or gift code that can be scaled upward depending on how badly Pew’s statistical model wants your specific race or age category represented in their spreadsheet. Pew Research Center’s own methodology disclosure details how this financial compensation structure works:
“All respondents were offered a post-paid incentive for their participation. Respondents could choose to receive the post-paid incentive in the form of a check or gift code to Amazon.com, Target.com or Walmart.com. Incentive amounts ranged from $5 to $20 depending on whether the respondent belongs to a part of the population that is harder or easier to reach. Differential incentive amounts were designed to increase panel survey participation among groups that traditionally have low survey response propensities.”
I voted to deport illegal immigrants and for less immigration—not to have them polled as if their opinions carry the same political weight as American citizens. Poll me, Pew. I’ll do it for free. You can save that money to conduct surveys that are actually representative of legal American citizens who don’t take polls for cash. The actual citizens who live legally, pay taxes, respect our laws every single day, and want to be heard. Not once, have I ever been polled.
Pre-election polling inherently relies on self-reported data, which poses an ongoing challenge for the 2026 midterms. While Pew Research Center builds its panel using physical addresses, its initial snapshot of 5,062 U.S. adults—which includes 3,917 self-reported registered voters and 1,145 unregistered or unverified adults—relies entirely on what respondents say about themselves.
While Pew frames these mechanisms as standard procedures, their official Wave 200 methodology statement provides the clear technical blueprint of how this sample was actively engineered:
“Data in this report comes from Wave 200 of the American Trends Panel (ATP), Pew Research Center’s nationally representative panel of randomly selected U.S. adults. The survey was conducted from Sept. 28 to Oct. 4, 2026. A total of 5,062 panelists responded out of 5,835 who were sampled, for a survey-level response rate of 87%.
The cumulative response rate accounting for nonresponse to the recruitment surveys and attrition is 3%. The break-off rate among panelists who logged on to the survey and completed at least one item is 1%. The margin of sampling error for the full sample of 5,062 respondents is plus or minus 1.6 percentage points.
The survey includes oversamples of Hispanic adults, non-Hispanic Asian adults and 18- to 29-year-olds in order to provide more precise estimates of the opinions and experiences of these smaller demographic subgroups. These oversampled groups are weighted back to reflect their correct proportions in the population.
SSRS conducted the survey for Pew Research Center via online (n=4,874) and live telephone (n=188) interviewing. Interviews were conducted in both English and Spanish.”
Pew flashes that 87% number to make it look like nearly everyone answered, but that high percentage only counts the people who are already inside their paid survey club. The truth is found in their 3% cumulative response rate. 97 out of 100 households originally targeted by Pew either threw the invitation in the trash or quit the panel entirely over time. Only 3 out of 100 households actually stuck around to finish the poll, meaning Pew is relying on a slice of chronic survey-takers while pretending they speak for the entire nation.
That oversampling note is the ultimate confession of how manufactured this data really is. Pew went out of their way to oversample Hispanic adults, Asian adults, and 18-to-29-year-olds—demographics that mathematically have the highest concentrations of non-citizens and the lowest historical turnout at physical ballot boxes. And they incentivize them with gift cards. Then, instead of filtering out the non-voters within those inflated demographics, they applied heavy statistical weighting formulas to forcefully twist the numbers back into a “population reflection” on paper.
Furthermore, the sample itself is incredibly thin for the massive political weight placed on the final headline result. It comes from a long-running panel with a cumulative response rate of about 3%. That number accounts for every single stage of non-response built into the panel over time: people who were randomly selected but never joined, people who joined but later dropped out, and people who were invited to this specific survey wave but did not complete it.
Out of every 100 adults originally eligible under the sampling design, only about 3 made it all the way through to answering this survey. Instead of polling fresh, random citizens, Pew is relying on a highly specific club of paid, oversampled, “professional” survey-takers with a lot of free time and a desire for gift cards. They do not represent the views of the full U.S. adult population. Instead, they measure a specific pool of participants whose answers are algorithmically adjusted until the spreadsheet looks correct on paper.
Pew is talking out of both sides of its mouth. They know a non-citizen shouldn’t be counted in election-related metrics—which is why they block them from the voting questions elsewhere in the study. But to manufacture a negative headline about President Trump only weeks before a midterm election, they intentionally blend those ineligible non-voter answers into the primary job approval rating to artificially drag the president’s number,
The fake news screams Pew’s poll: Donald Trump’s overall presidential job approval sits at 30% approve versus 68% disapprove. Within that 68% total disapproval block, 52% of the total sample stated they “strongly disapprove” of his performance. Wow, 52 percent “strongly” disapprove—truly a devastating blowout if you ignore the fact that they literally had to bribe and badger people to get it.
Based on these skewed numbers, the media claims Democrats are more eager to vote this fall. They want you to look at their manufactured percentages and believe that the nation has completely turned against the president.
Pew Research Center draws much of its U.S. public-opinion research from the American Trends Panel, a pool of roughly 10,000 adults who agree to answer surveys repeatedly. Many individual polls use only a subset of that pool rather than recruiting a completely new group each time. Pew adds new panelists annually and drops inactive ones, so the membership changes over time—but the total number of active panelists remains roughly 10,000.
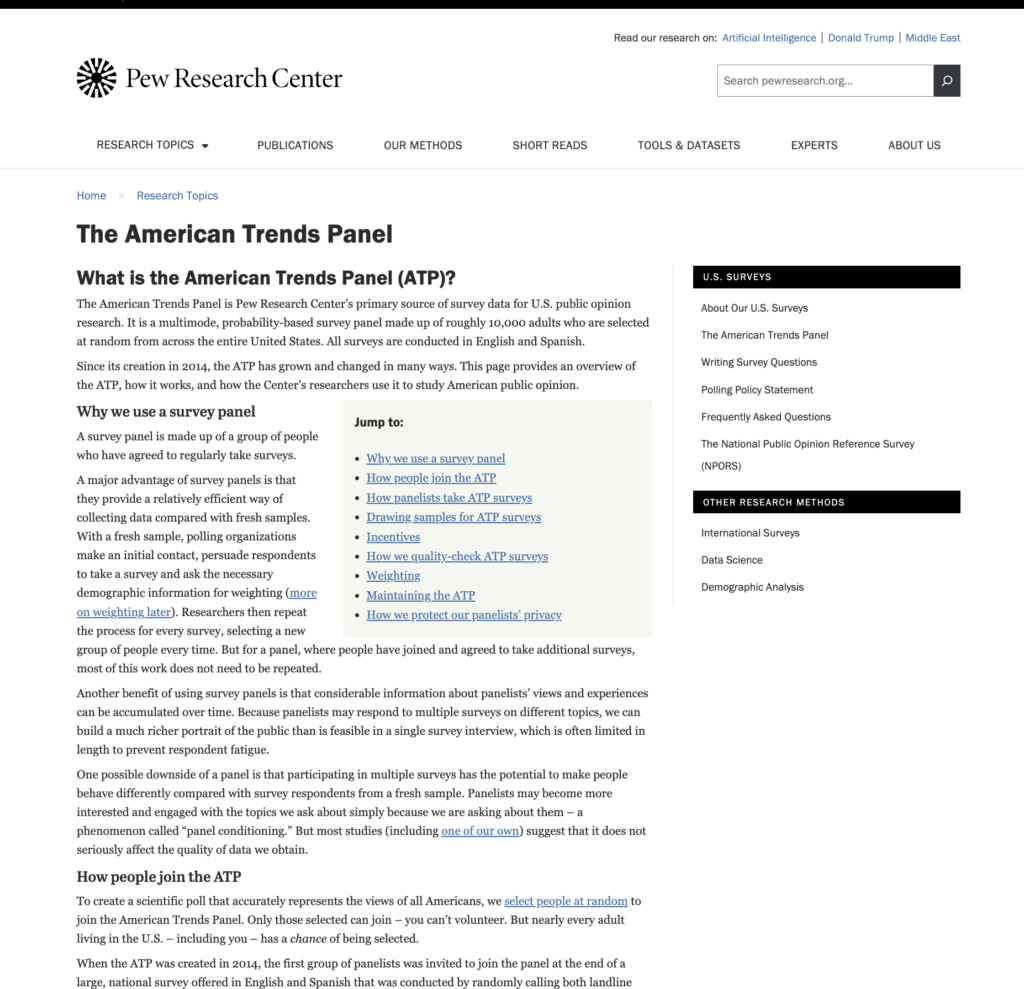
READ MORE AT https://www.pewresearch.org/the-american-trends-panel/